 Seal the Secret !!
2022-Aug-18

By:DALEEP SINGH
2020-Jun-12 11:06:13
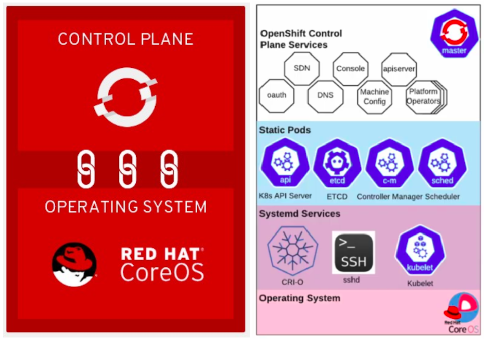
OpenShift 4 comes with a immutable OS + OpenShift control plane layer which increase the management and security from the platform perspective and also make the update process more easier and transparent. However, due to the emphasis on security and being immutable, it also is challenging to troubleshoot the platform as in OpenShift nodes used to form the cluster.
Even though, we don’t have much services running with OpenShift except, Kubelet and CRIO, rest everything now runs with OpenShift operators managing them and in their respective projects.
The big question, that now comes is how to access the nodes and also check the status of services, if we need to verify and troubleshoot the services/platform configuration.
In this article, I will take you through the steps you need to follow to access the worker nodes and what happens behind the scene to make it possible for us. So let’s move ahead and dive deep into oc debug node command.
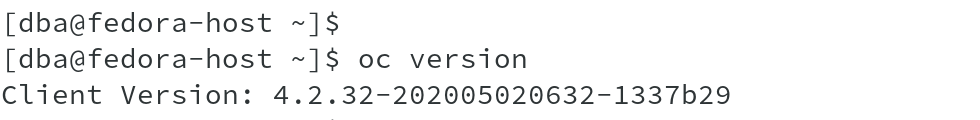
I have a small cluster running with me which is deployed on AWS cloud.
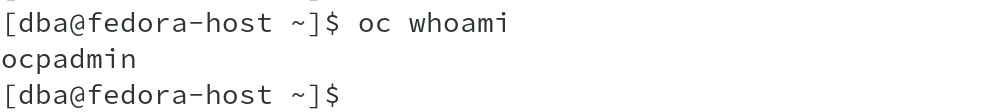
The list of nodes shows that currently we are running with 03 Master and 02 worker nodes in the cluster.
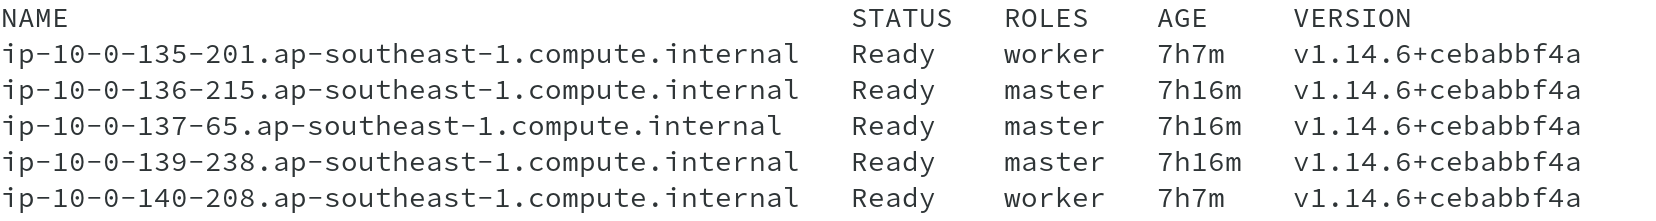
As you can see that we have a list of projects for almost everything, ranging from router, registry, SDN, DNS etc and their corresponding operator projects.
From the previous displayed list of nodes, let us take one of the nodes to run oc debug command and run the command:
# oc debug node/node-to-connect
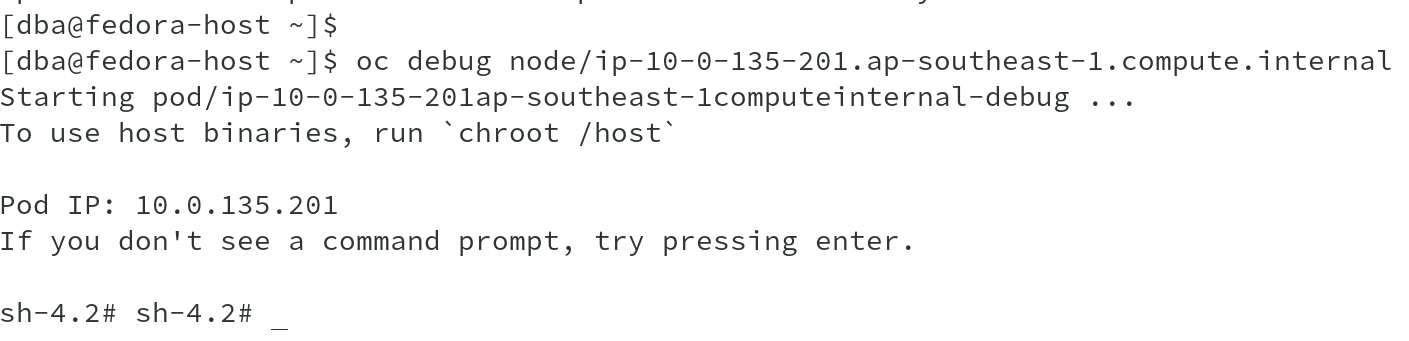
Once you are connected to the node, it prompts you to run command chroot /host to access the node filesystem. Why would be do that when we are already connected to the node?
This is because, we don’t login directly or run ssh to the node, however, when we run the command oc debug node, it launches a new container on the node and provides you with the container shell. The host file system is mapped to /host folder in this container and when you run chroot /host, you connect to the node filesystem and can run all binaries available on the nodes.
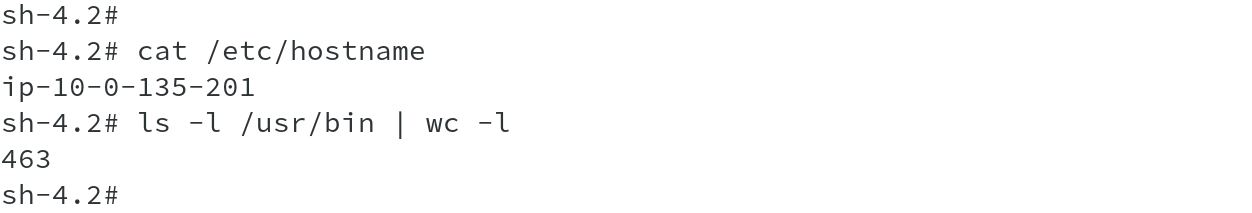
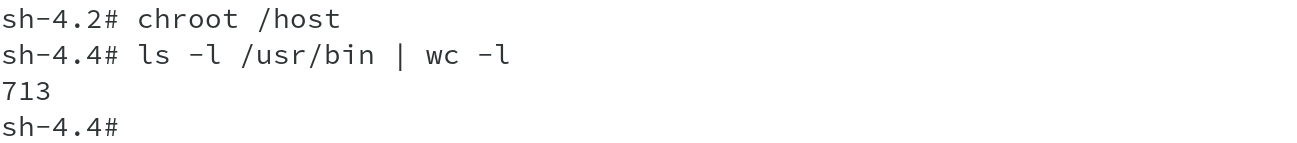
To quickly show the difference, I did a quick count of binaries before and after chroot and it clear shows that post chroot, you have more binaries available.
Before chroot:
Post chroot:
So far, we have been able to identify that using chroot, we were able to access the host filesystem and run host commands. Let us dig more and see what actually happened.
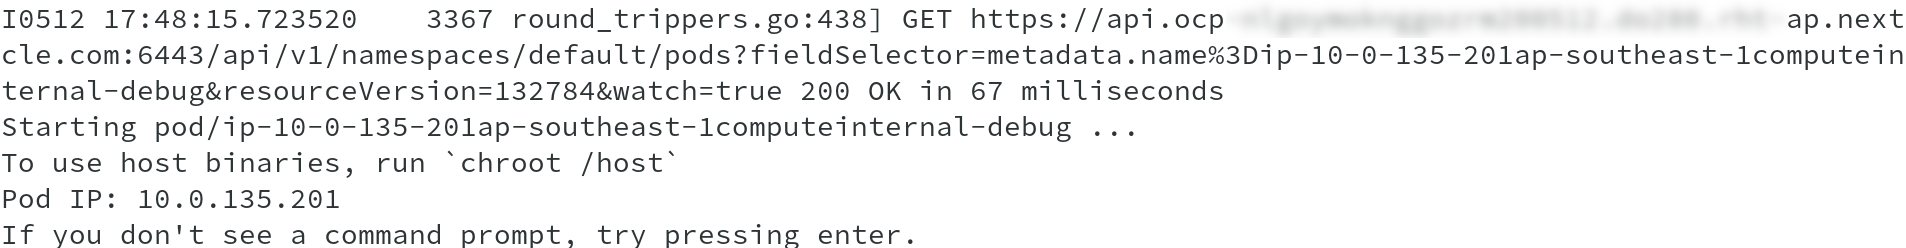
I ran oc debug node command again, however, this time in increased log-level and see the API calls and actions being done and I was able to see what happens when we run the command.
#oc debug node/ip-10-0-135-201.ap-southeast-1.compute.internal --loglevel 6
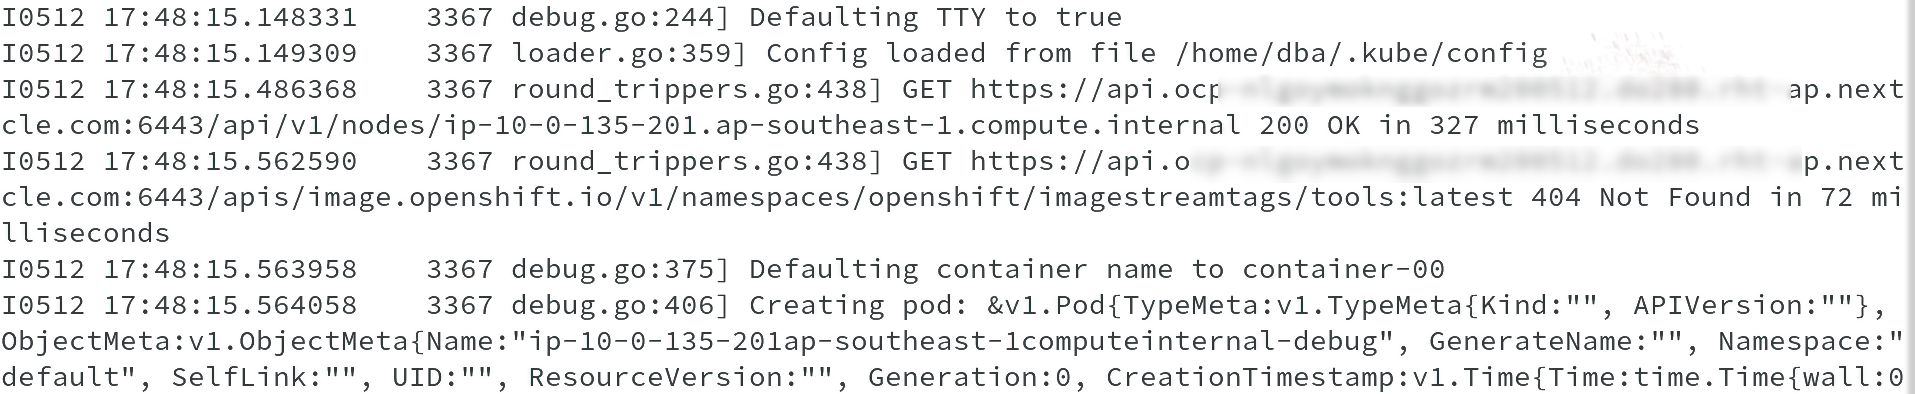
From above output, it is clearly seen that a pod is getting created, which holds a container with the default container name as container-00.
In the following one, you can see the properties of the container, namely the image being used, volume mapping etc and volume mapping shows MountPath /host.
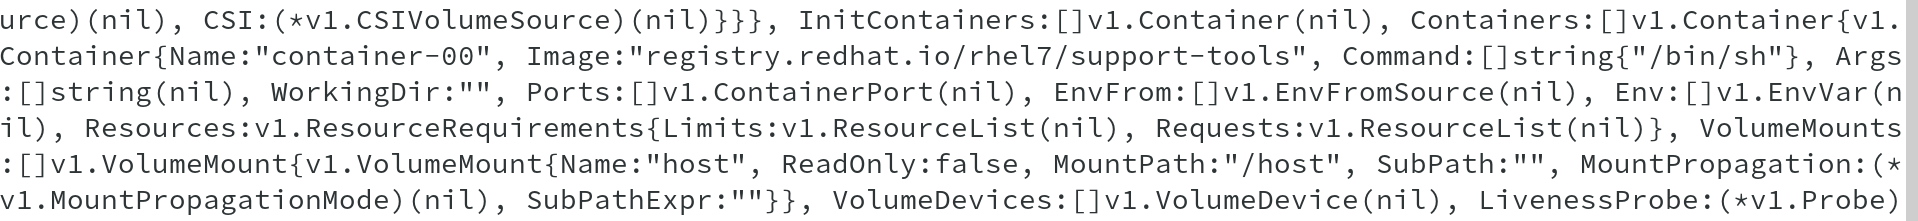
Also we can see that it is getting creating with shared network and PID namespaces from host.

And in the end, post all this, the pod gets created and you get a message, To use host binaries, run ‘chroot /host’.
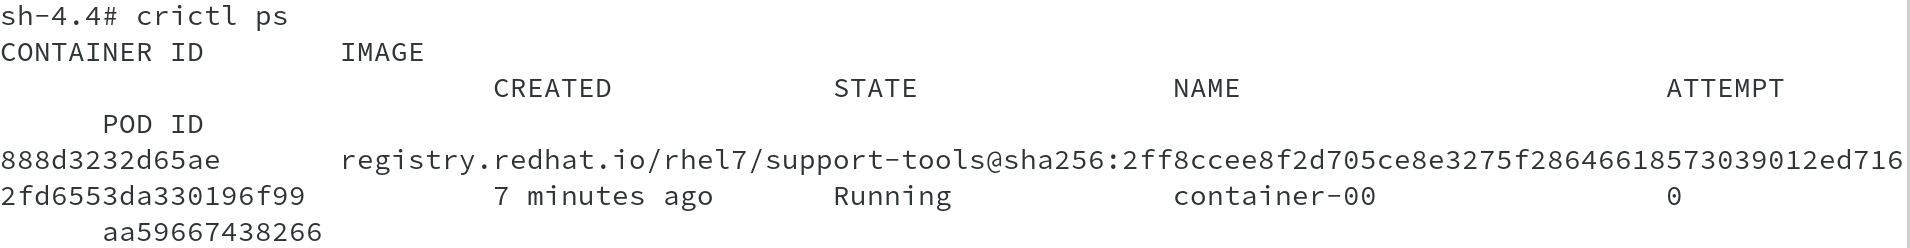
Using crictl, which is a command-line interface for CRI-compatible container runtimes, let us list the pod and container in that pod to identify the debug pod and container-00.

The next image, shows the container Container-00 listed using crictl ps command. Observe the Pod ID for the container, it matches the Pod ID in the previous output, which has the name ip-10-0-135-201ap-southeast-1computeinternal-debug. This is the debug pod created.
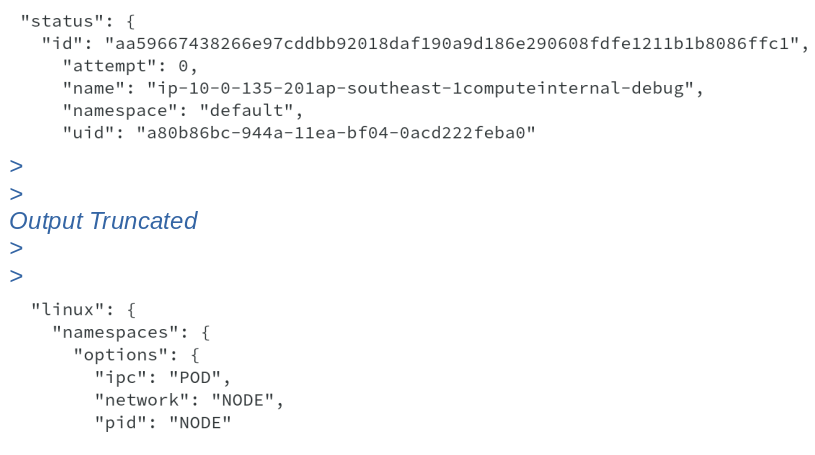
On doing pod inspect, we get Pod ID, name and also linux namespaces information, which shows that is using IPC of Pod, however, PID and Network namespaces from node.
Running the crictl images command lists all the images available on the node, however, we are interested in the rhel7/support-tools image.

The Red Hat Enterprise Linux Support Tools container image contains tools to analyze the host system, including sos, strace and tcpdump. This image is externally available from below mentioned URL:
https://catalog.redhat.com/software/containers/detail/5a2537edac3db95fc9966015?container-tabs=gti
We are using this image to create a debug container and mount host filesystem to /host in the container.
Now that we have seen the pod created, its time to also do a quick inspect of the container created using crictl inspect command.

The ouput shows the container name, container-00, state, image used to create it, some labels identifying the pod and kubernetes namespace.
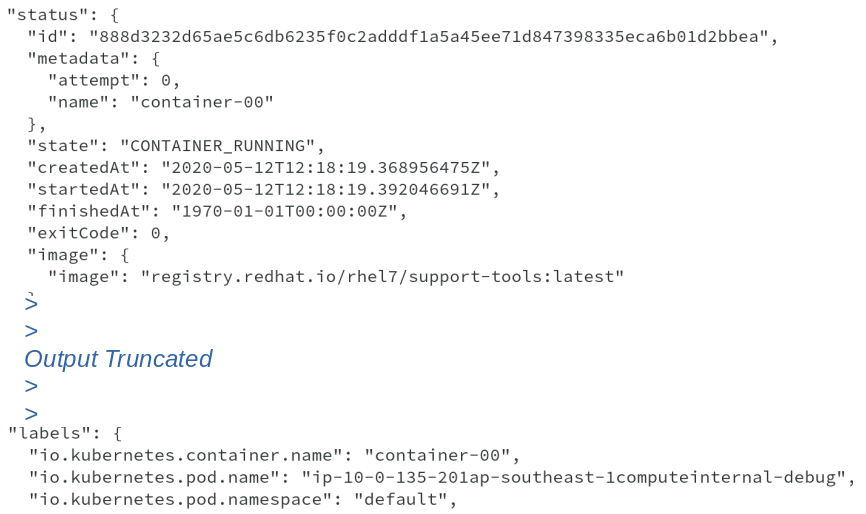
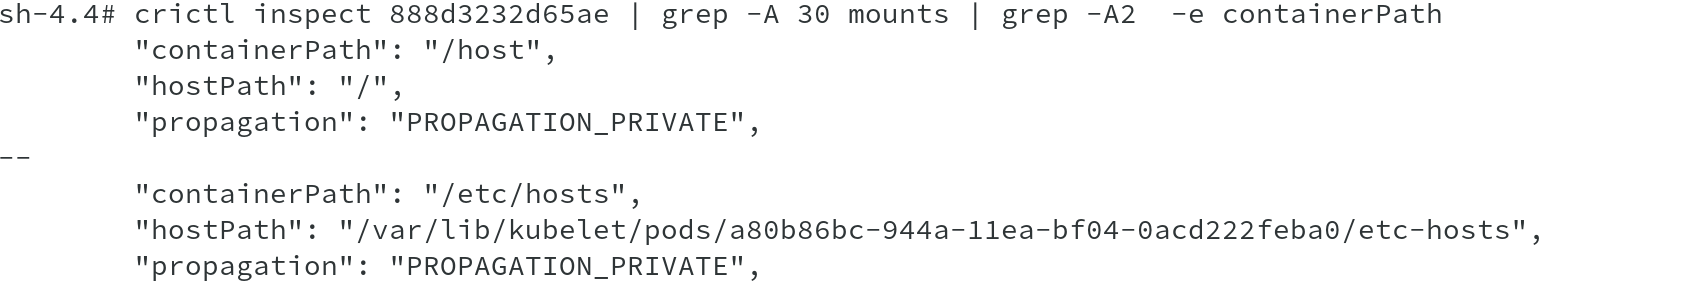
It also shows the mounts done automatically by the debug node command to mount the / filesystem from node to /host on the container along with other mounts.
Due to this volume mapping of the mount point, we are able to access all the node binaries by doing chroot to /host .
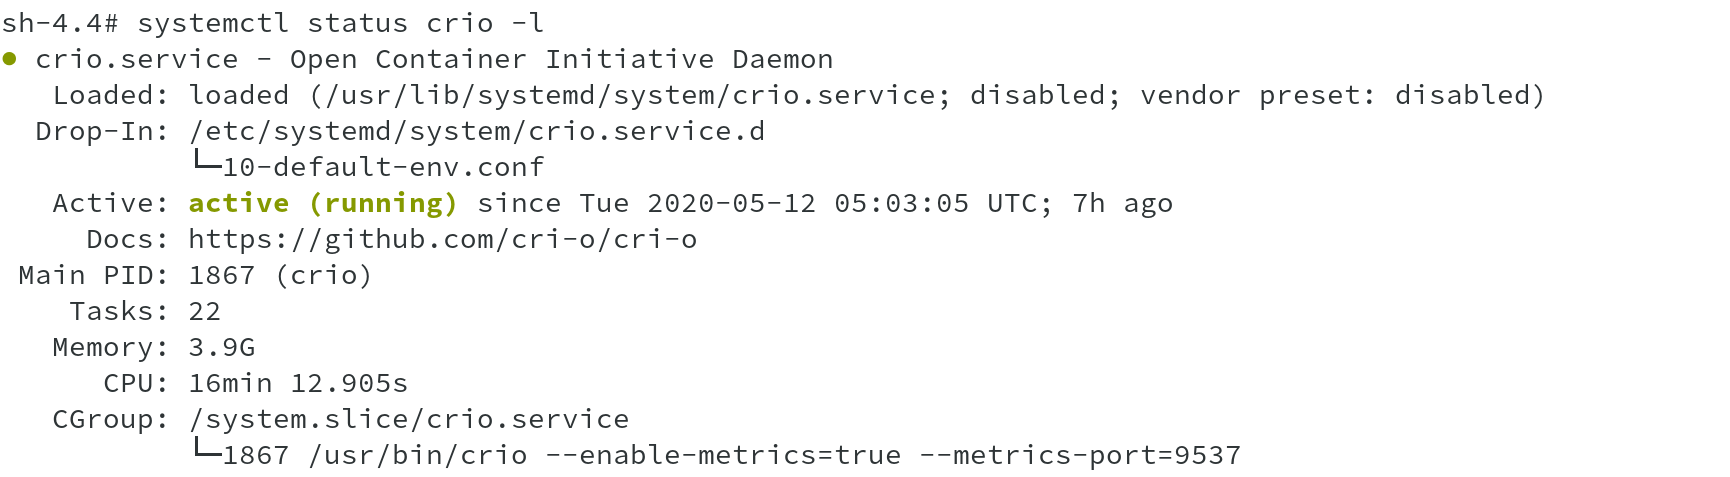
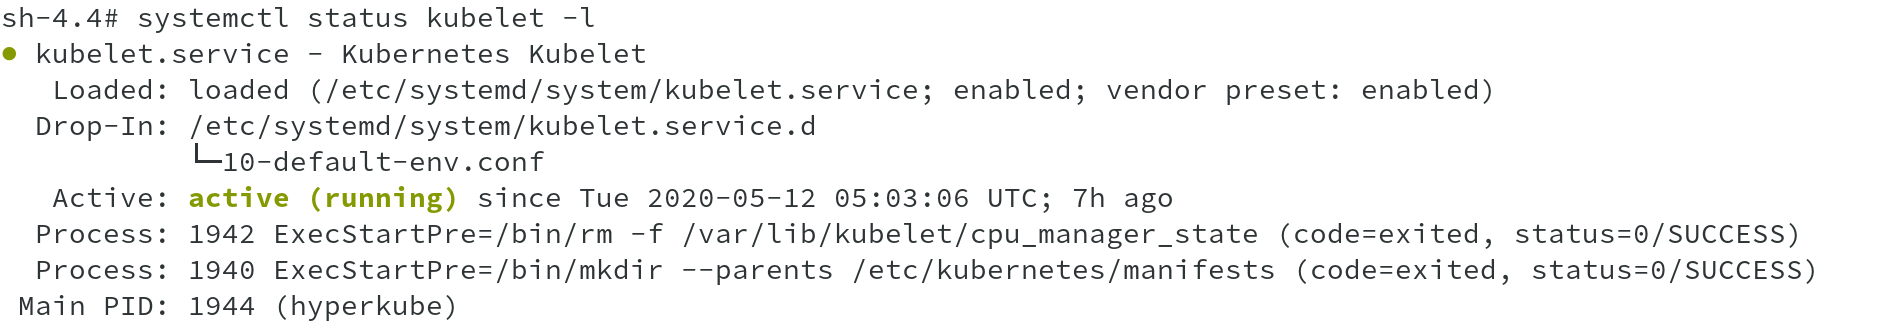
Now that we have seen how oc debug node works, why not go ahead and check the status of kubelet and crio daemons. These are the only two major OpenShift
related systemd services which now runs on OpenShift 4 nodes.
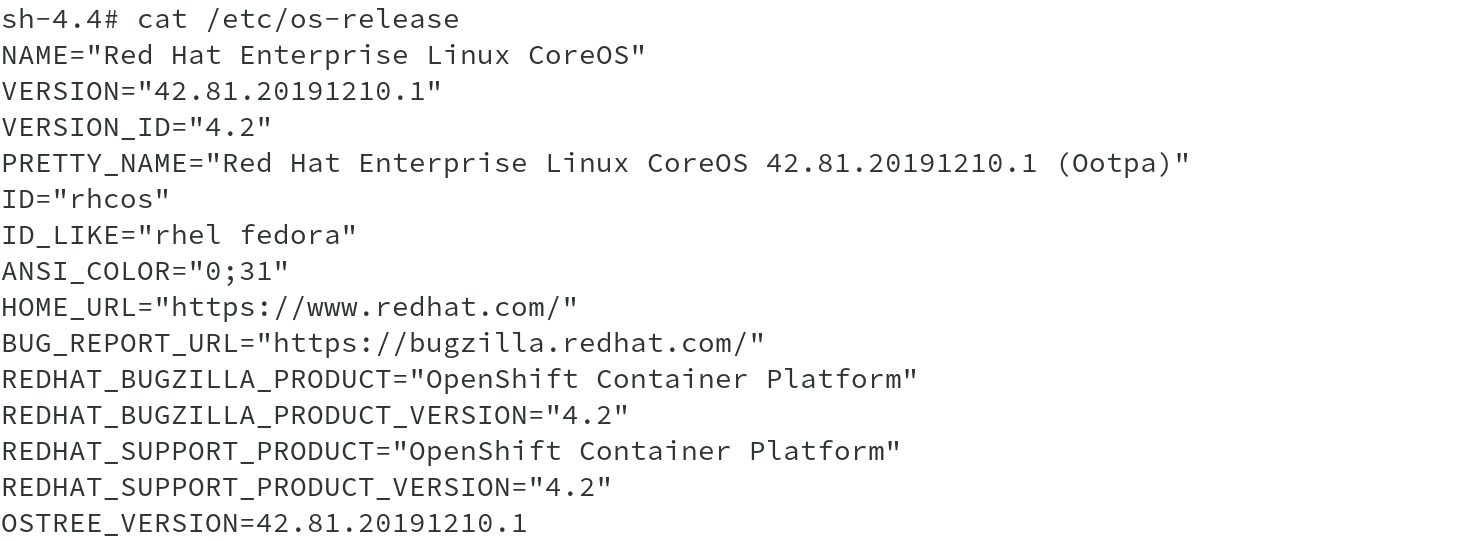
A quick peek into /etc/os-release file shows the OS running and its version along with OpenShift version and OSTree version.
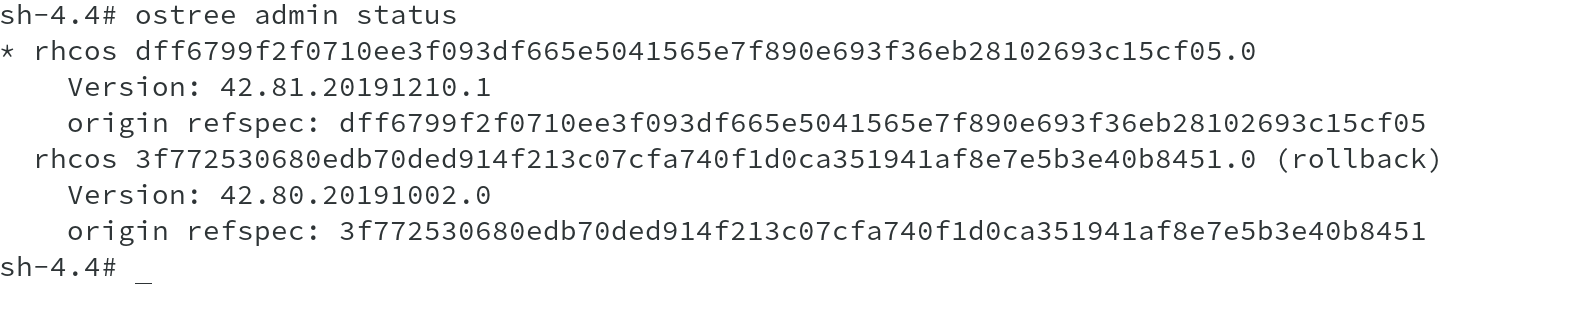
RHCOS supports transactional upgrades using the rpm-ostree system. Updates are delivered in form of container images and are part of the OpenShift update process. When updated, the container image is pulled, extracted, and written to disk, then the bootloader is modified to point to the new version of image and boot in that in a rolling manner to ensure minial effect to the cluster.
I tried to show this using ostree admin status command, which clearly indicates the current version being used. The commit with the star next to it is the currently deployed image, which also matches the version information from previous output.
We have seen enough to understand how oc debug node command works and what we are capable of doing using this command. Even though, it doesn’t allow us to make lot of changes and most of the changes to the nodes will also be done through operators, we can atleast identify and debug issues with OpenShift nodes. Now its time to close the session and log out of the debug pod.
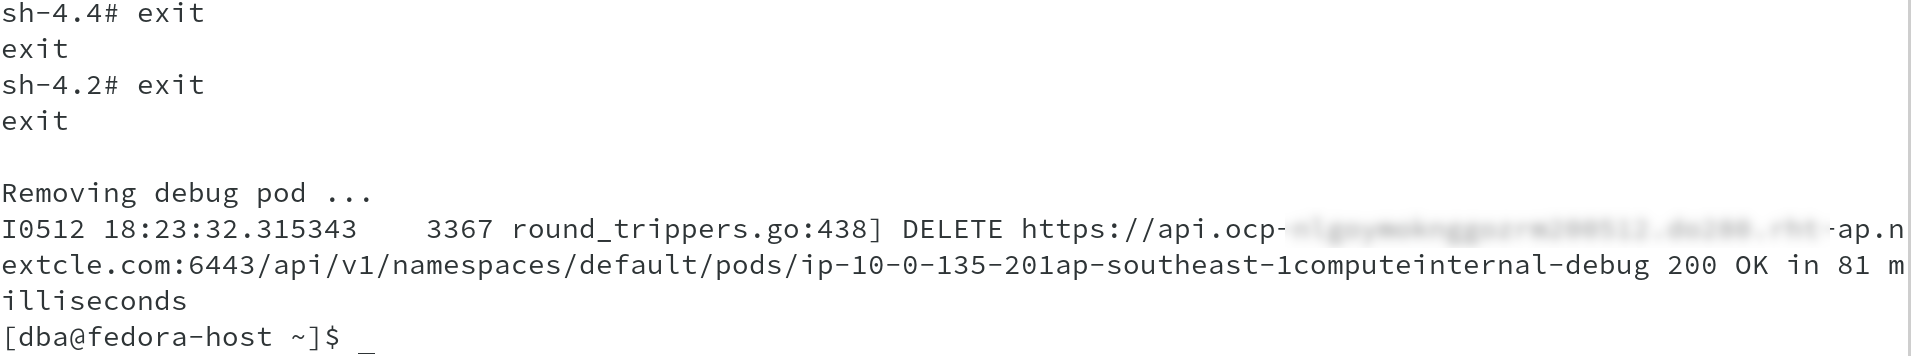
On doing exit twice, you will see that debug pod gets deleted automatically and you are back on your oc client host.
I hope I was able to provide some insight on oc debug node.