 Seal the Secret !!
2022-Aug-18

By:DALEEP SINGH
2020-May-22 11:05:34
In previous articles, we saw how to create and manage containers and pods with Podman. Won’t it be good if we have some functionality available to do a healthcheck on the container created with podman.
Podman release 1.12 introduced capability to perform container healthcheck. This way now we can check the health of the container and ascertain that the application process(es) running inside the container is/are ready to serve/handle the application requests.
Healthcheck comprises of setting a healthcheck command to run inside the container, interval for healthchecks, number of retries allowed before healthcheck is considered unhealthy, start period, the initialization time needed for a container to bootstrap and a timeout period which defines maximum time allowed to complete the healthcheck.
Lets go ahead and see how healthcheck can be set on containers with podman and also see how it is implemented in such a daemonless environment.
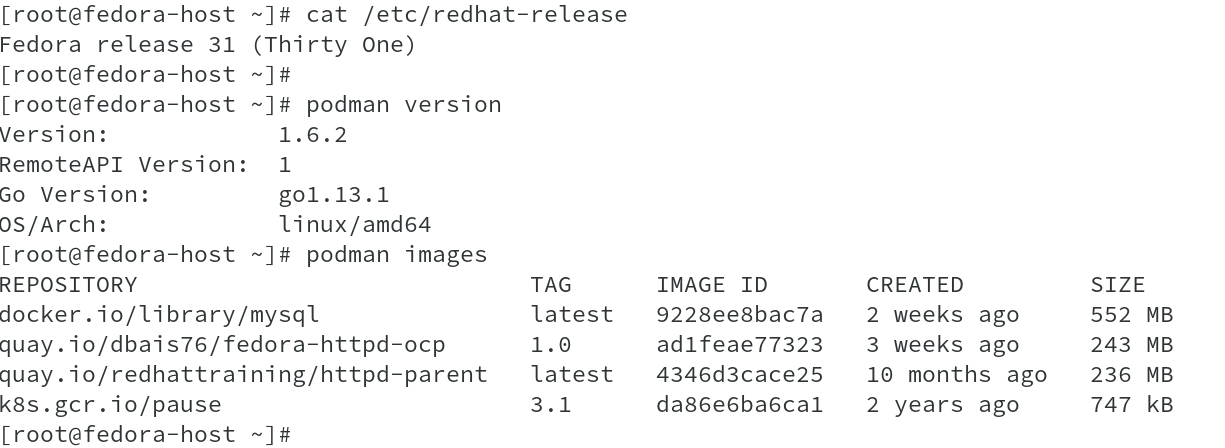
To perform healthcheck test, I am using a fedora 31 host with podman version 1.6.2 installed on it. The image used is a custom image of httpd running on port 8080 ( Ref: quay.io/dbais76/fedora-httpd-ocp:1.0 ).
Start a container with healthcheck enabled and various options set along with it such as healthcheck interval and healthcheck timeout, as shown. The healthcheck command in this case runs a command in the container and check for return as exit code 0 OR exit on failure.
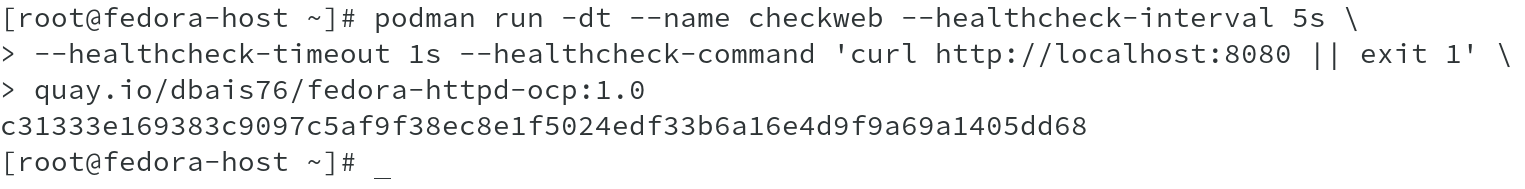
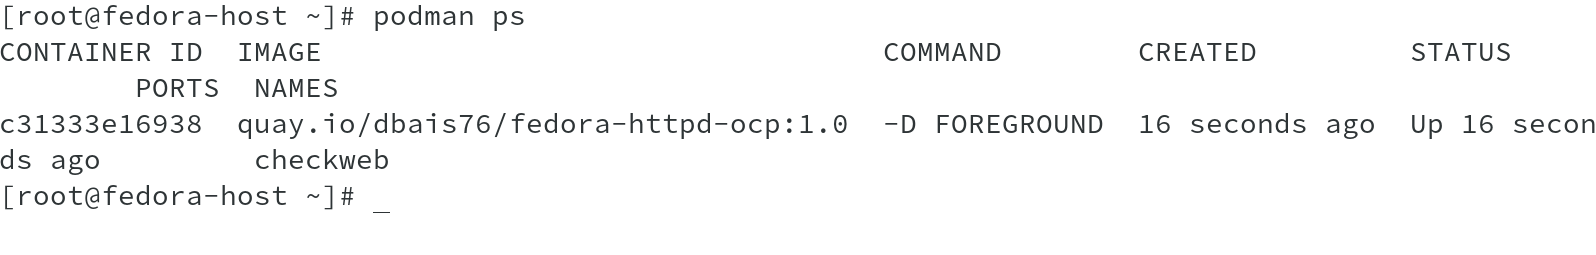
The container starts and keeps running with the web server process.
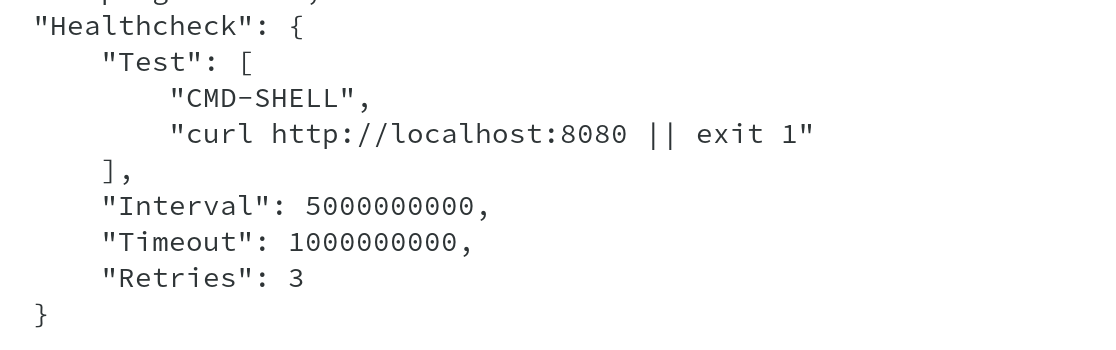
Running podman inspect checkweb shows Healthcheck being enabled for the container.
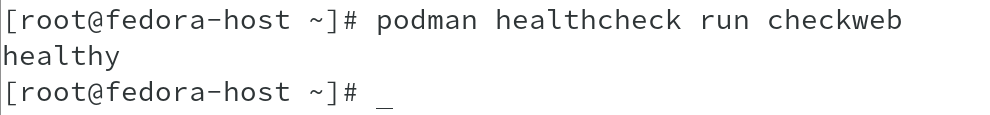
Running podman healthcheck command with container name as argument shows the container health status, which in this case shows Healthy.
Let us first start by checking the systemd timer to check the timer which has been created for the podman healthcheck scheduling. The unit corresponds to the container ID which was created by podman run command.
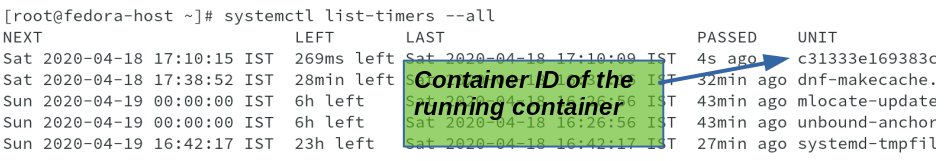
Due to lot of content in the output, I had to truncate and only showing the unit and the service it activates, and both corresponds to the container ID.

Running command systemctl list-units --all will list the timer along with its status. You can always pipe the output to grep with container ID to get required information.
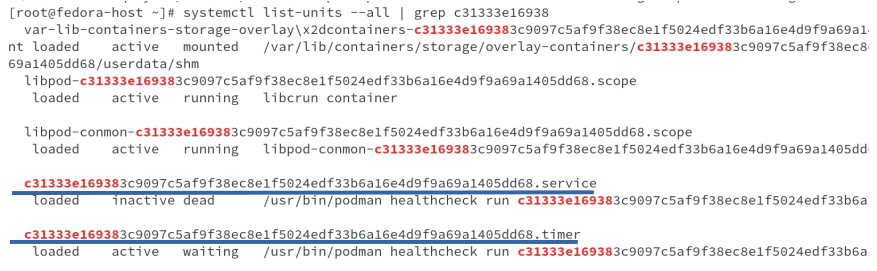
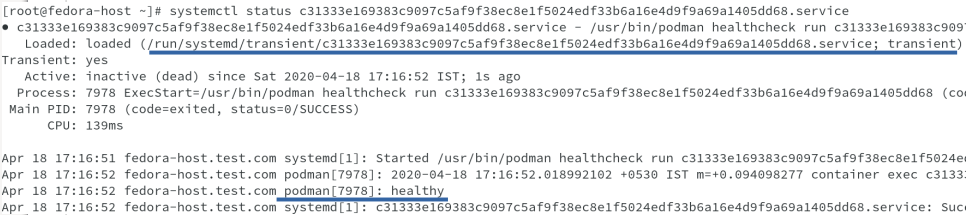
The above output clearly shows that, podman uses systemd and it sets up a transient systemd service and timer ( Transient unit files are created dynamically with the runtime API. Transient units may not be enabled.). The .service file defines the healthcheck command and .timer is for scheduling of the healthcheck.
Now let us see the transient service which is used to run the test and also later on see the service and timer unit files to enforce this discussion.
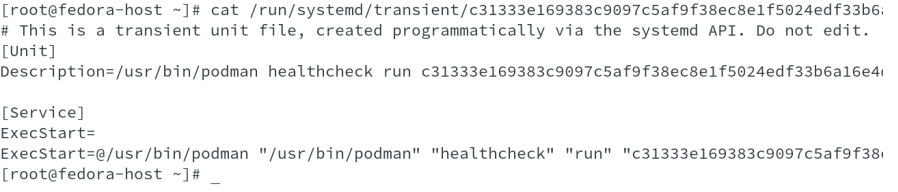
cat /run/systemd/transient/c31333e169383c9097c5af9f38ec8e1f5024edf33b6a16e4d9f9a69a1405dd68.service shows us the below output for the service unit file. ( output truncated to fit the display)
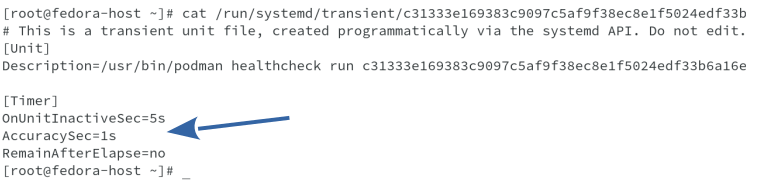
cat /run/systemd/transient/c31333e169383c9097c5af9f38ec8e1f5024edf33b6a16e4d9f9a69a1405dd68.timer shows the output for .timer unit.
This brings us to the end of this discussion. Enjoy settings container healthchecks with Podman.
Next article, we will talk about podman container restart policies.
Happy Reading!!!